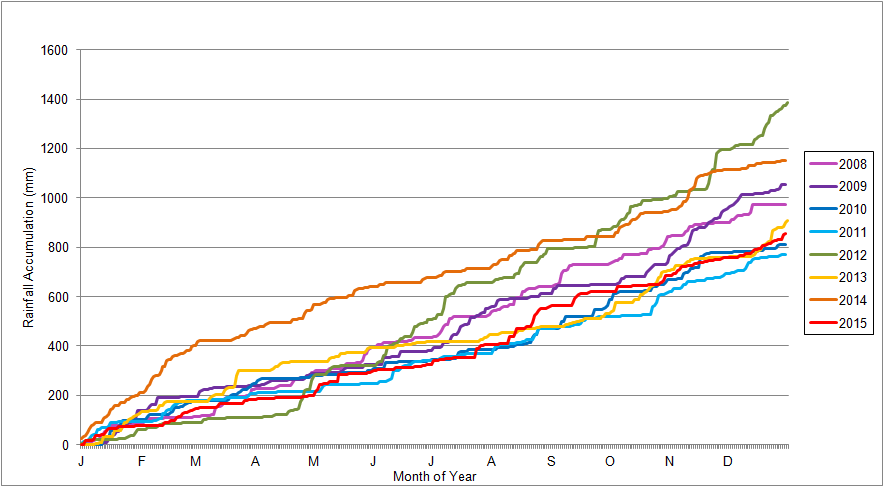


Rainfall Accumulation Chart:
The chart below shows how the rainfall accumulation for each year has risen as the year went on, which shows how wet or dry a year or period is relative to other years. You can see how 2012 started dry but became record breakingly wet, and how the first half of 2014 was way ahead of previous years, mainly due to the exceptionally wet January and February.
Below is a text file summary, and a ‘rainfall accumulation chart’ of the rainfall recorded by the weather station over the months and years since it was set up:
Rainfall Table:
Chart updated to the end of December.