


Comments on data:
On some days 0.2mm of rain may = dew.
Data recording started in the evening of the 4th.
* Suspicions rainfall amount on
the 16th may have over-
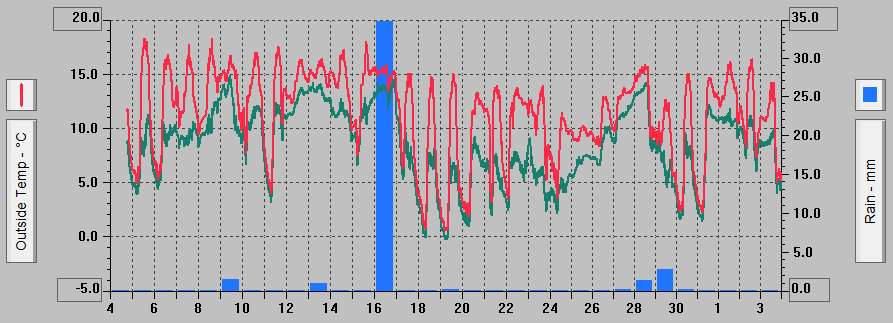
Graphs for October:
Graph for October 2007 (4th Oct - 4th Nov) showing Air Temperature (red), Dew Point (green) and Daily Rainfall (blue).
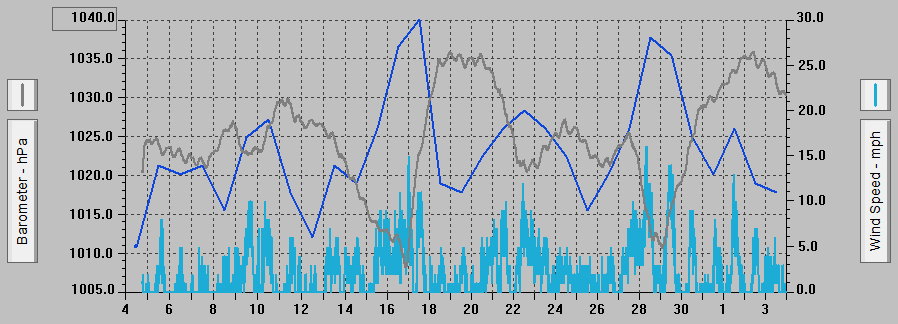
Graph for October 2007 showing Air Pressure (grey), 10 Minute Average Wind Speed (light blue) and the Highest Gust that day (darker blue)
Graph for October 2007 (4th Oct -
Graph for October 2007 showing Air Pressure (grey), 10 Minute Average Wind Speed (light blue) and the Highest Gust that day (darker blue)