


Comments on data:
On some days 0.2mm of rain may = dew or frost melt.
Graphs for January:
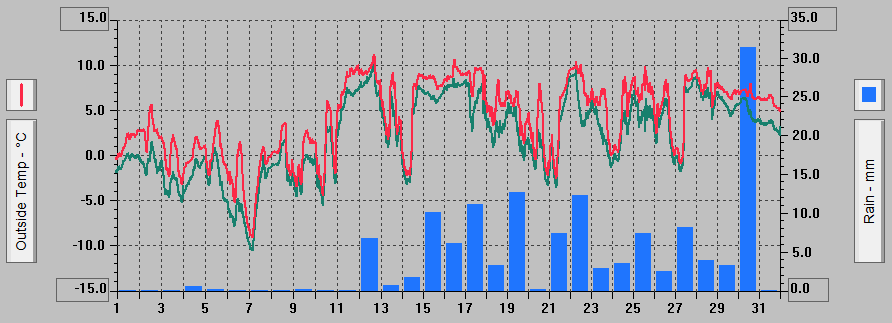
Graph for January 2009 showing Air Temperature (red), Dew Point (green) and Daily Rainfall (blue).
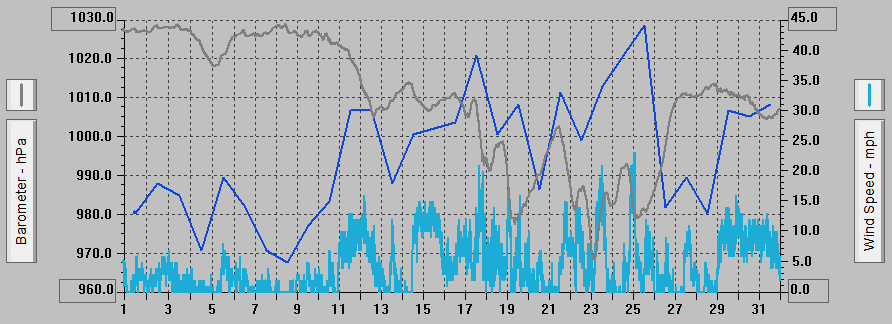
Graph for January 2009 showing Air Pressure (grey), 10 Minute Average Wind Speed (light blue) and the Highest Gust that day (darker blue)
Graph for January 2009 showing Air Temperature (red), Dew Point (green) and Daily Rainfall (blue).
Graph for January 2009 showing Air Pressure (grey), 10 Minute Average Wind Speed (light blue) and the Highest Gust that day (darker blue)